CASE STUDY · CUSTOMER & RETENTION ANALYTICS
Customer Retention Intelligence
An interactive customer intelligence platform that makes churn patterns, high-impact segments, reported reasons, potential drivers, and financial exposure easier to investigate and act on.
Turning customer records into a clearer view of retention risk.
A company-wide churn rate shows the size of a retention problem, but it does not reveal which customers are most exposed, which segments create the greatest impact, or what patterns deserve deeper investigation.
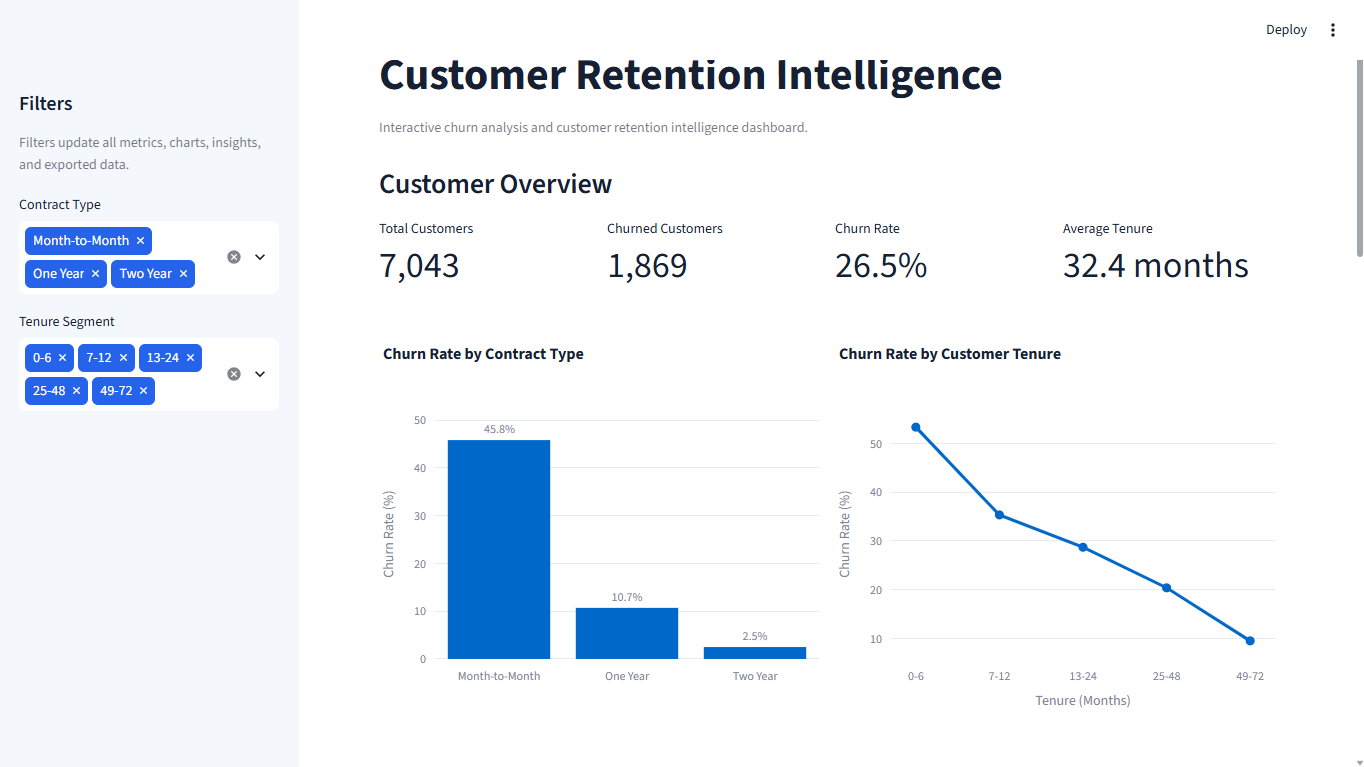
This project transforms 7,043 telecom customer records into a layered retention analysis. It connects top-level KPIs with contract and tenure segmentation, reported churn reasons, an interactive driver explorer, priority segments, and financial indicators.
The dashboard keeps observed associations separate from causal claims, providing decision support without presenting descriptive patterns as predictive guarantees.
Segmentation designed to show both rate and business impact.
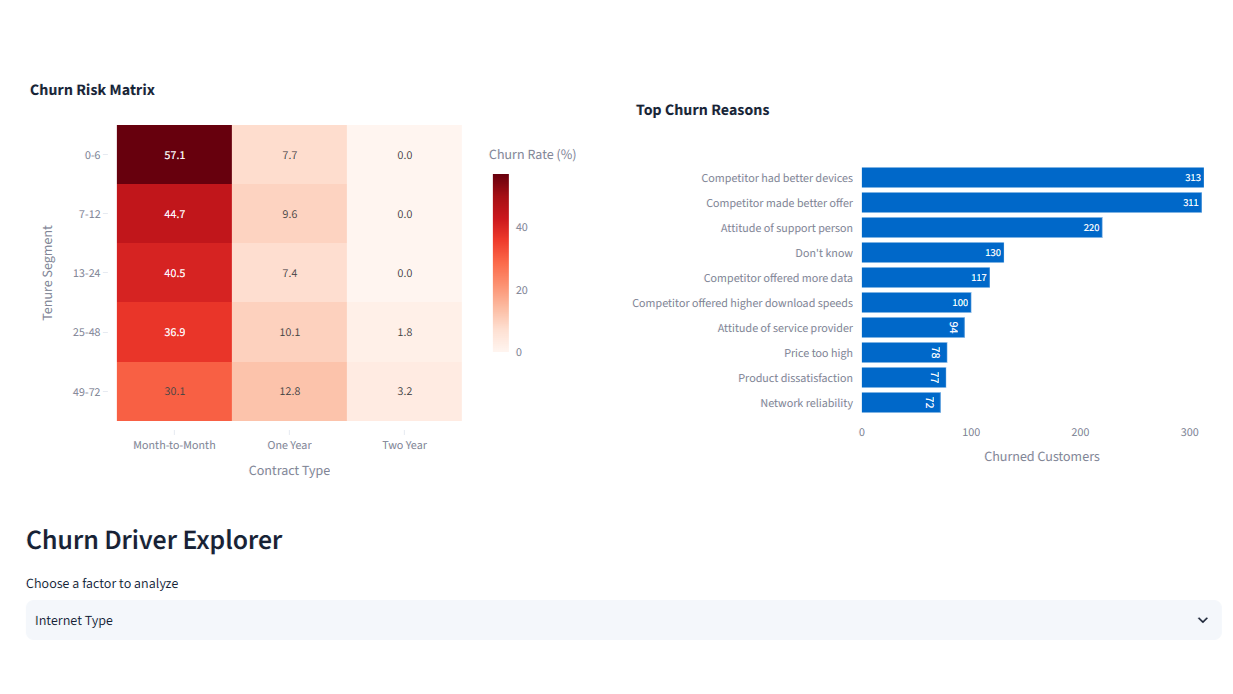
Contract type and customer tenure are combined in a risk matrix so high churn rates can be evaluated alongside the number of affected customers. This avoids prioritizing a small segment only because its percentage appears high.
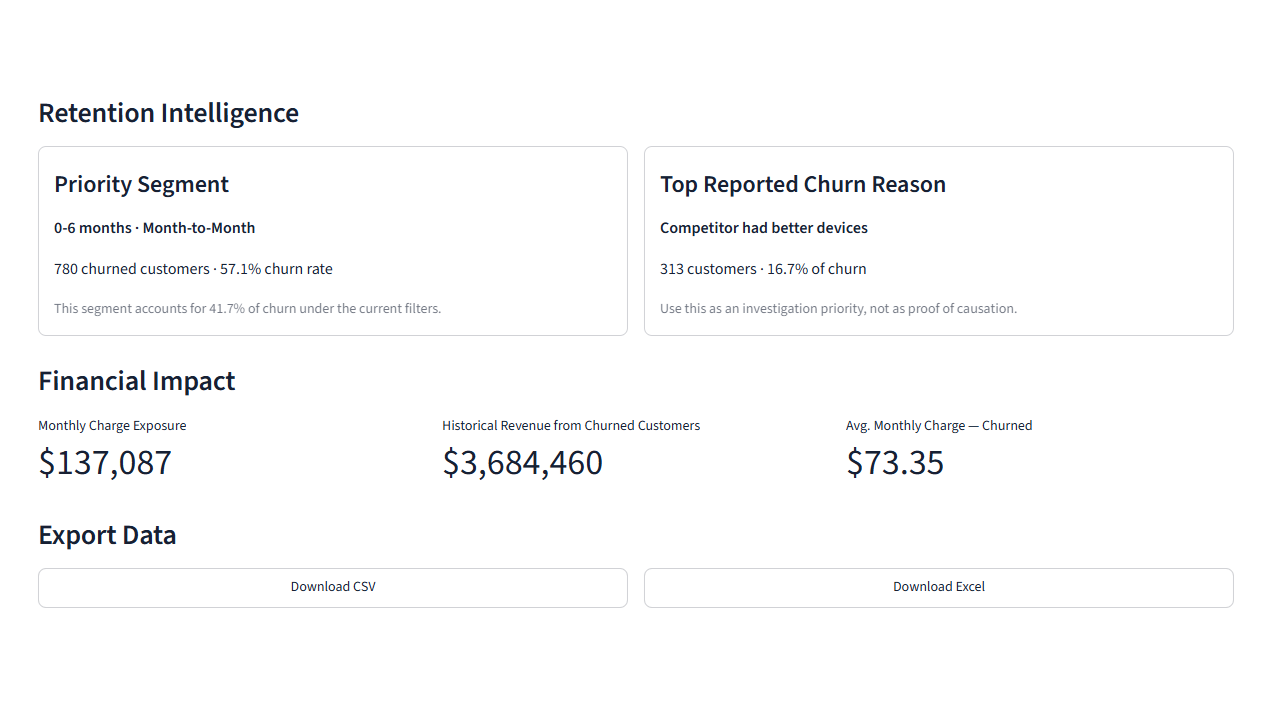
The 0–6 month, month-to-month segment recorded a 57.1% churn rate and 780 churned customers, making it the strongest observed priority segment in the dataset. Reported churn reasons add customer context, with competitor device offerings appearing most frequently.
- Contract and tenure-based segmentation
- Risk matrix combining churn rate and customer volume
- Reported churn-reason analysis
- Priority-segment identification
- Filter-aware customer and churn KPIs
Behavioral context without overstating what the data proves.
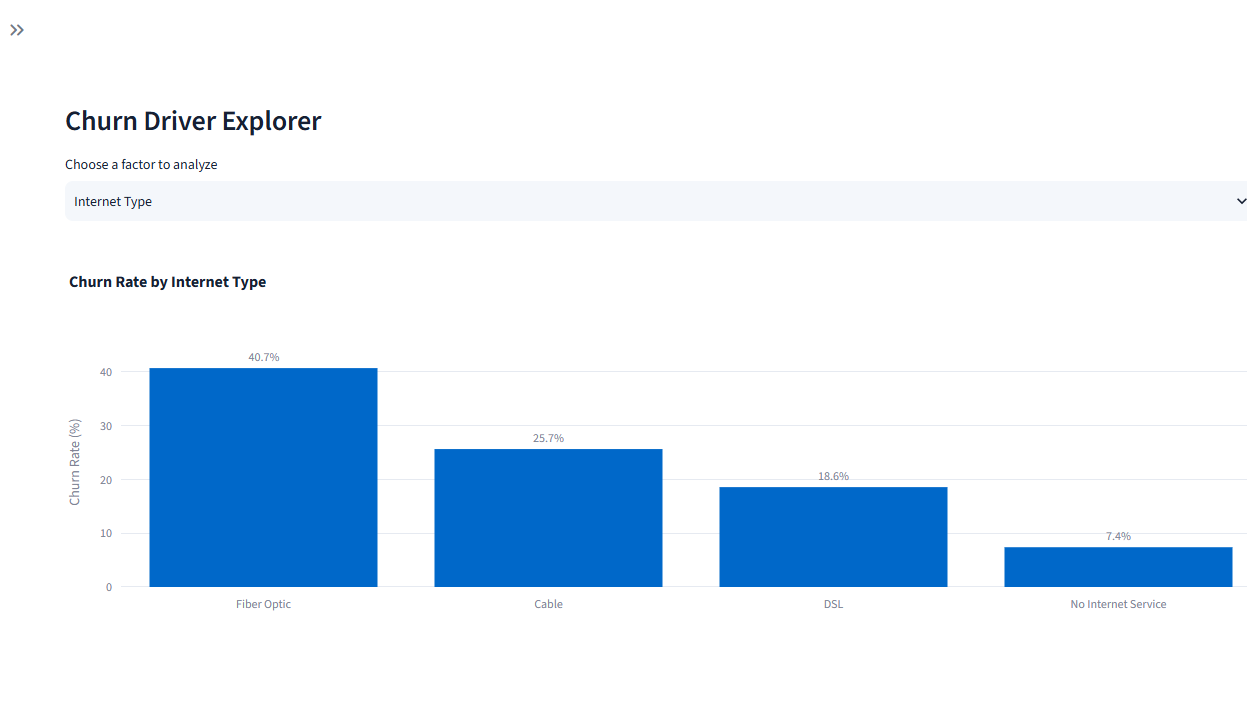
The Driver Explorer lets users compare observed churn rates across internet type, premium technical support, online security, payment method, and customer offers. These views help surface relationships worth investigating while clearly avoiding causal interpretation.
Missing values are handled according to their business meaning. Internet attributes remain distinct for customers without internet service, phone attributes reflect customers without phone service, non-churned customers are not assigned artificial churn reasons, and missing offer values are represented as No Offer.
Filtered customer data can be exported as CSV or Excel, allowing the analysis to continue beyond the dashboard while preserving the selected segment.
From overall churn to segment-level retention intelligence.
Four connected views move from current performance into risk concentration, potential drivers, and decision-oriented retention summaries.
Technology stack: Python · Pandas · Streamlit · Plotly · OpenPyXL