CASE STUDY · BUSINESS ANALYTICS & REPORTING
Business Analytics & Reporting Platform
An end-to-end analytics workspace that turns raw, multi-dimensional sales data into consistent KPIs, interactive performance analysis, automated insights, and decision-ready reports.
From inconsistent sales records to a reliable reporting workflow.
Operational sales files often contain duplicated transactions, invalid dates, missing financial values, and inconsistent categories. Without a shared cleaning and calculation process, every report can produce a different version of performance.
This platform combines data preparation, KPI calculation, interactive filtering, analysis, and export generation in one reusable workflow. Raw records are cleaned once, business metrics are calculated consistently, and every dashboard view responds to the same active filters.
The result is not a collection of isolated charts, but a reporting system designed to move from raw data to a clear business view with less manual work.
A modular analytics pipeline built around data quality.
The application separates loading, cleaning, filtering, analytics, visualization, insight generation, data-quality checks, and report creation into focused modules. This keeps calculations reusable and makes the workflow easier to maintain and extend.
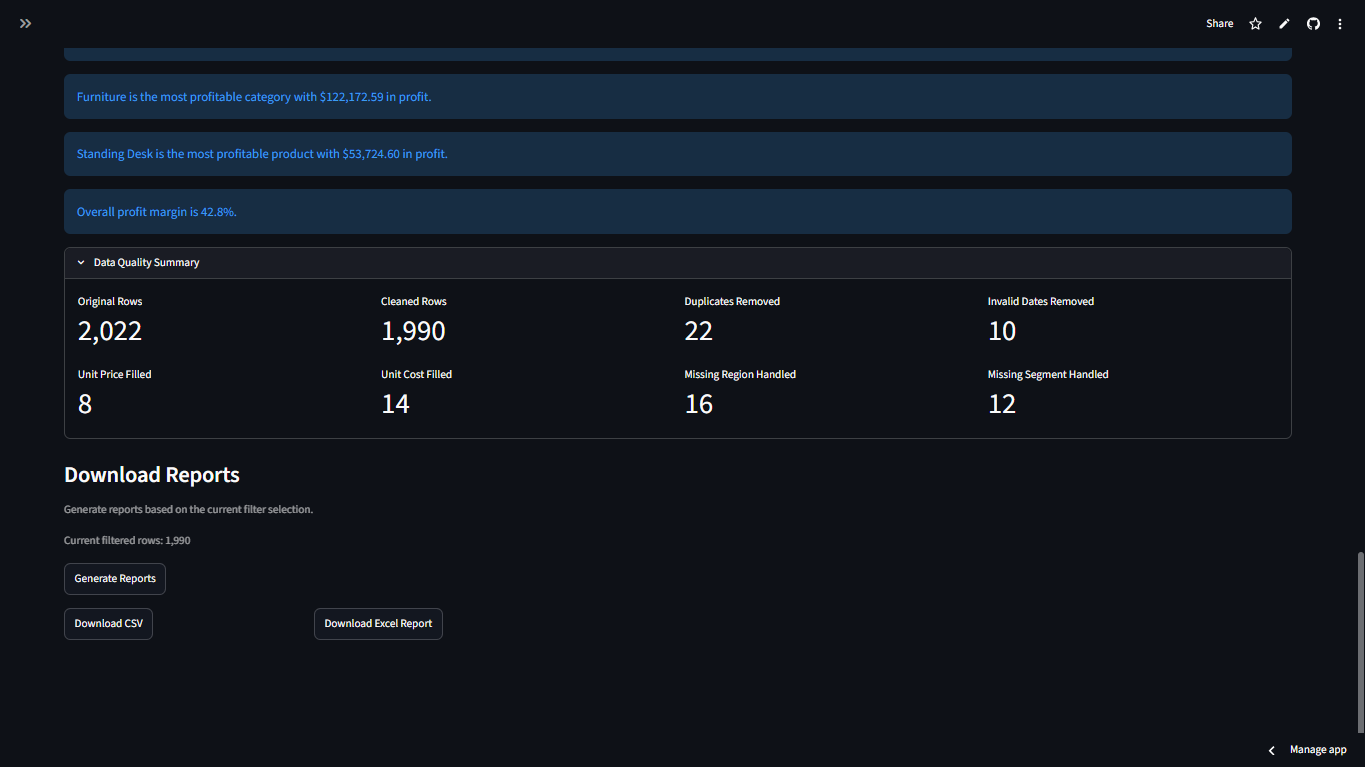
Duplicate rows and invalid dates are identified before analysis. Missing unit prices and costs are filled using product-level median values, while missing categorical fields remain visible as Unknown instead of being silently discarded.
- Automated data cleaning and validation
- Consistent revenue, profit, order, AOV, and margin calculations
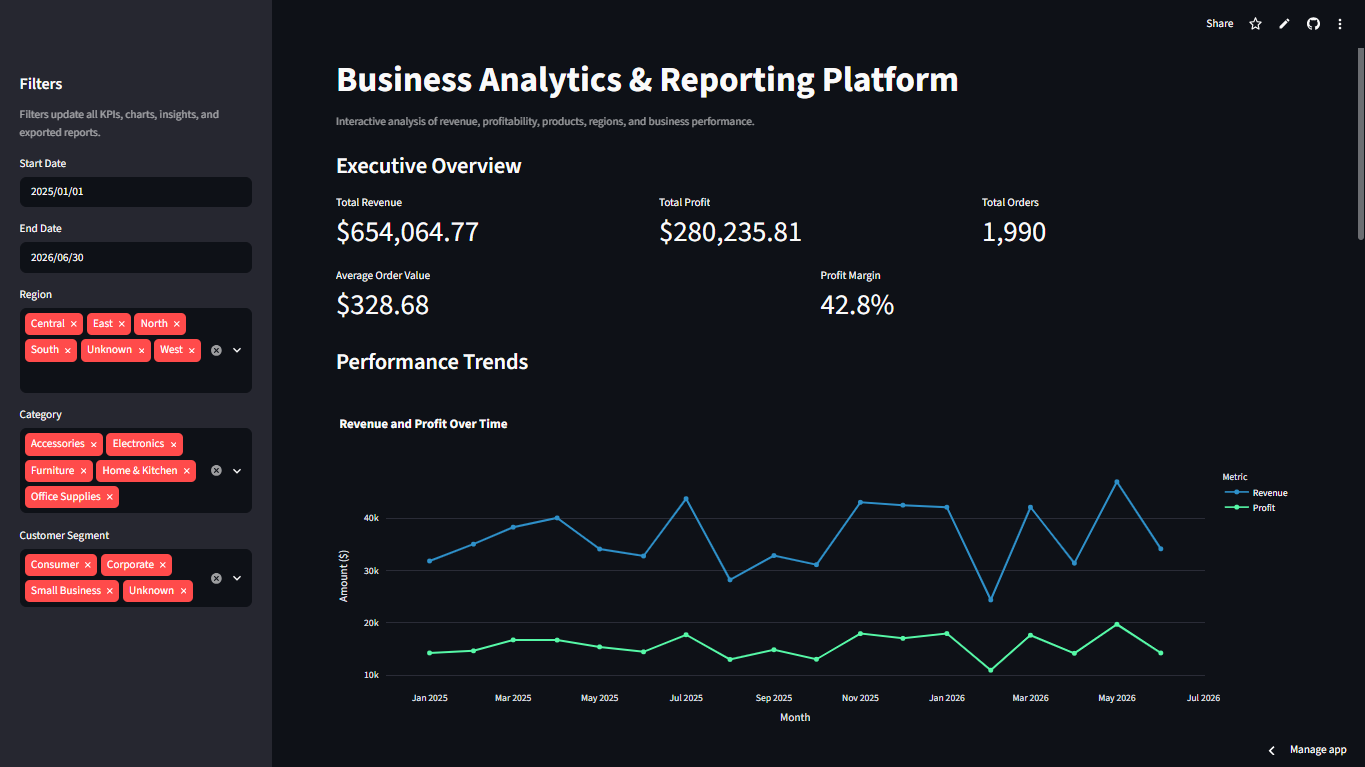
- Date, region, category, and customer-segment filters
- Reusable analytics and visualization modules
- Data-quality summaries for transparent reporting
Interactive analysis that stays connected to the active business context.
Every KPI, chart, and generated insight updates when the user changes the dashboard filters. This makes it possible to move from a company-wide overview into a specific date range, region, category, or customer segment without rebuilding the report.
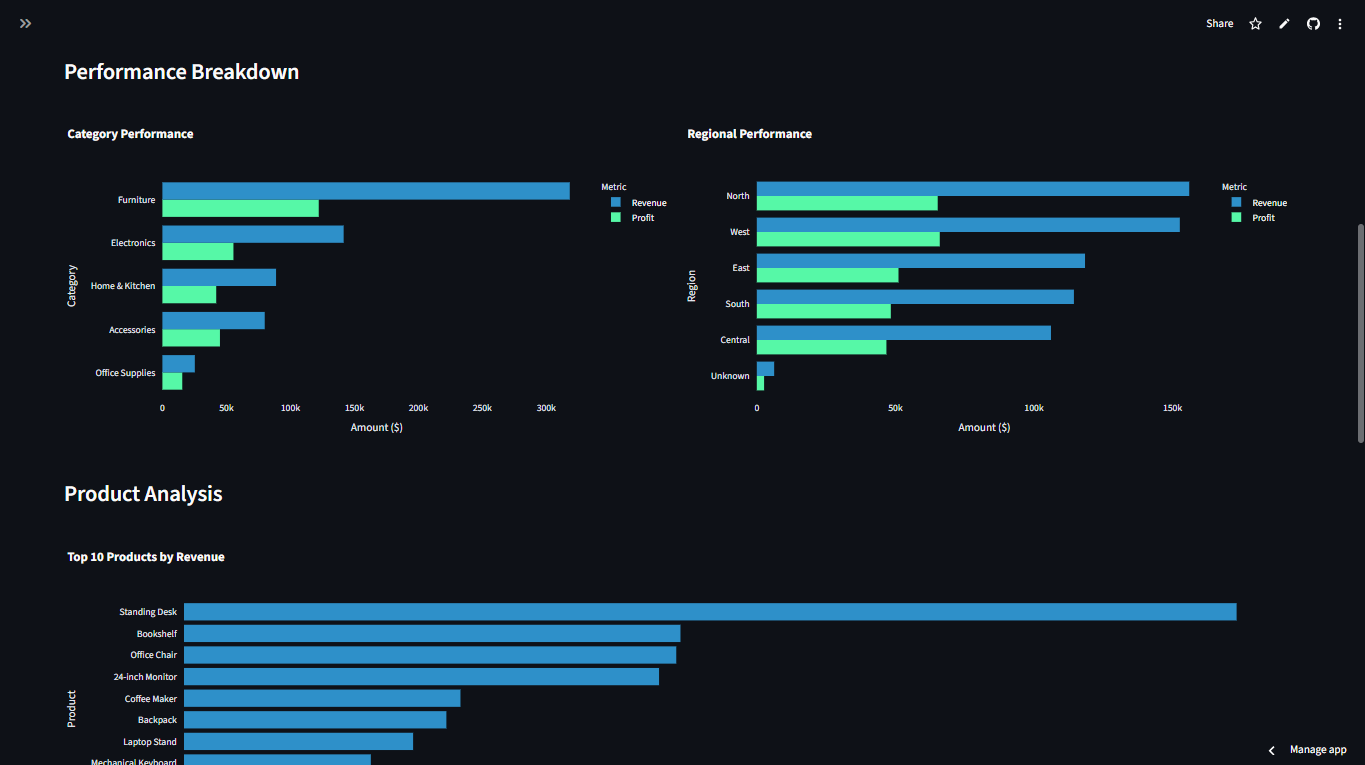
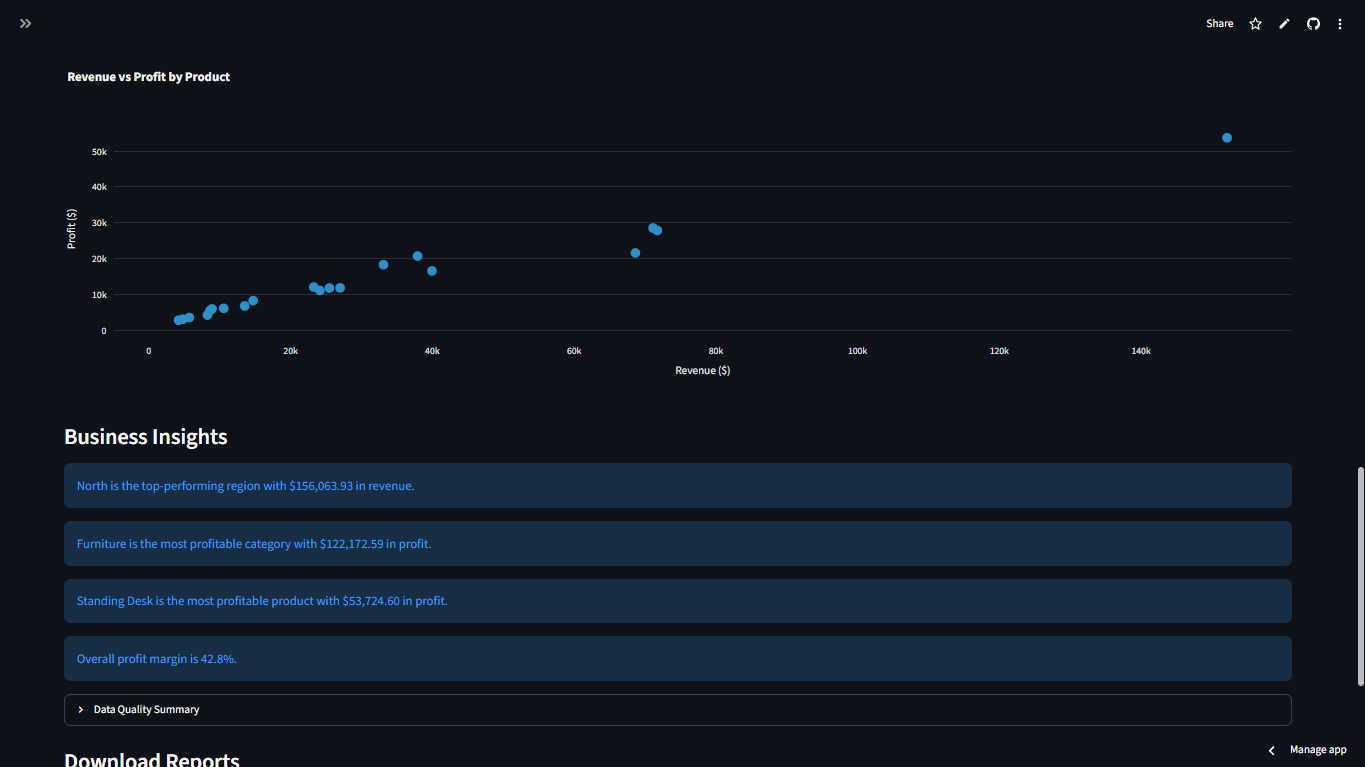
The platform compares revenue and profit over time, surfaces category and regional performance, identifies leading products, and explores the relationship between revenue and profitability.
Automated insights summarize the strongest region, category, product, and overall margin for the selected data. Filtered results can then be downloaded as CSV or as a formatted five-sheet Excel report containing an executive summary, KPIs, product performance, regional analysis, and row-level data.
One workflow, from executive overview to exportable reporting.
The interface connects performance monitoring, deeper analysis, automated interpretation, and report generation in a consistent analytics experience.
Technology stack: Python · Pandas · Streamlit · Plotly · OpenPyXL